Millions of people now receive their lab results through a patient portal before they ever speak to a clinician. A screen full of acronyms — ALT, HDL, eGFR, MCV, TSH — arrives with numbers, arrows, and little explanation. Learning how to enter blood test results online free and get an instant, structured interpretation closes that gap between receiving data and understanding it. This 2026 guide walks through every practical decision: whether to upload a file or type values by hand, what information you need, how to judge whether a free tool is genuinely safe, what accuracy you can reasonably expect, and what to do once the report appears.
We publish at blood-test.life, an independent consumer-health company founded in 2024 (legal entity Blood Test Life Inc, Delaware). Our analyzer is powered by Kantesti's AI infrastructure, and it is free during the 2026 public beta. Throughout this article we cite named authorities — the World Health Organization, CDC, NIH, USPSTF, the American Diabetes Association, and standards bodies such as IFCC and LOINC — because interpreting a blood panel responsibly means anchoring every number to a real reference, not a guess.
Upload a PDF or Photo vs. Typing Values
There are two ways to enter blood test results online: hand the tool a document (a PDF export from your portal, or a photo of a printed report) and let optical extraction read it, or type each biomarker and value into a form yourself. Both work. They fail in different ways, and understanding those failure modes helps you pick the right path for your report.
Uploading a PDF or photo
A native PDF downloaded from a portal is the gold standard. The text layer is machine-readable, so an AI extraction engine can map every analyte to its value, unit, and the lab's own reference interval with very high fidelity. A photo is more variable: glare, skew, low resolution, and handwriting all degrade extraction. Modern engines handle photos remarkably well — our system reads 10,000+ lab formats — but a crisp scan always beats a hurried phone shot in poor light. The advantage of upload is obvious: a comprehensive metabolic panel plus a lipid panel and CBC can carry 30 or more biomarkers, and typing all of them invites transcription errors.
Typing values manually
Manual entry is the right choice when you have only a handful of numbers, when your report is a photo too blurry to trust, or when you simply want to explore a single result like fasting glucose or HbA1c. The cost is human error. Studies of manual clinical data entry consistently find error rates in the low single-digit percentages per field — a transposed digit (140 typed as 410), a decimal slip, or the wrong unit. On a 30-field panel, a 1-2% per-field error rate means a real chance that at least one value is wrong. That is why, whenever a legible document exists, we recommend upload.

Rule of thumb
Have a PDF from your portal? Upload it. Only a phone photo? Upload if it's sharp, otherwise type the key values. Just one or two numbers to check? Manual entry is fast and fine.
What Data You Need and What You Get Back
You do not need much to check blood test results online free. At minimum, each biomarker needs three things: a name, a value, and a unit. Units matter enormously because the same analyte is reported differently around the world. Glucose is mg/dL in the United States and mmol/L across most of Europe and Asia; the conversion is mg/dL × 0.0555 = mmol/L. Cholesterol converts with mg/dL × 0.0259 = mmol/L. A good analyzer detects and normalizes units automatically on upload, but if you type values manually, always confirm you selected the unit printed on your report.
Two optional details sharpen the interpretation: your age and biological sex. Reference intervals are not universal — they are partitioned. Hemoglobin, creatinine, ferritin, and many hormones have different healthy ranges for men and women, and pediatric ranges shift week by week in early life. Our engine draws on the CALIPER pediatric and NORIP Nordic adult reference partitions, plus CDC 2024 population data, so age- and sex-specific ranges are applied rather than a single one-size-fits-all band.

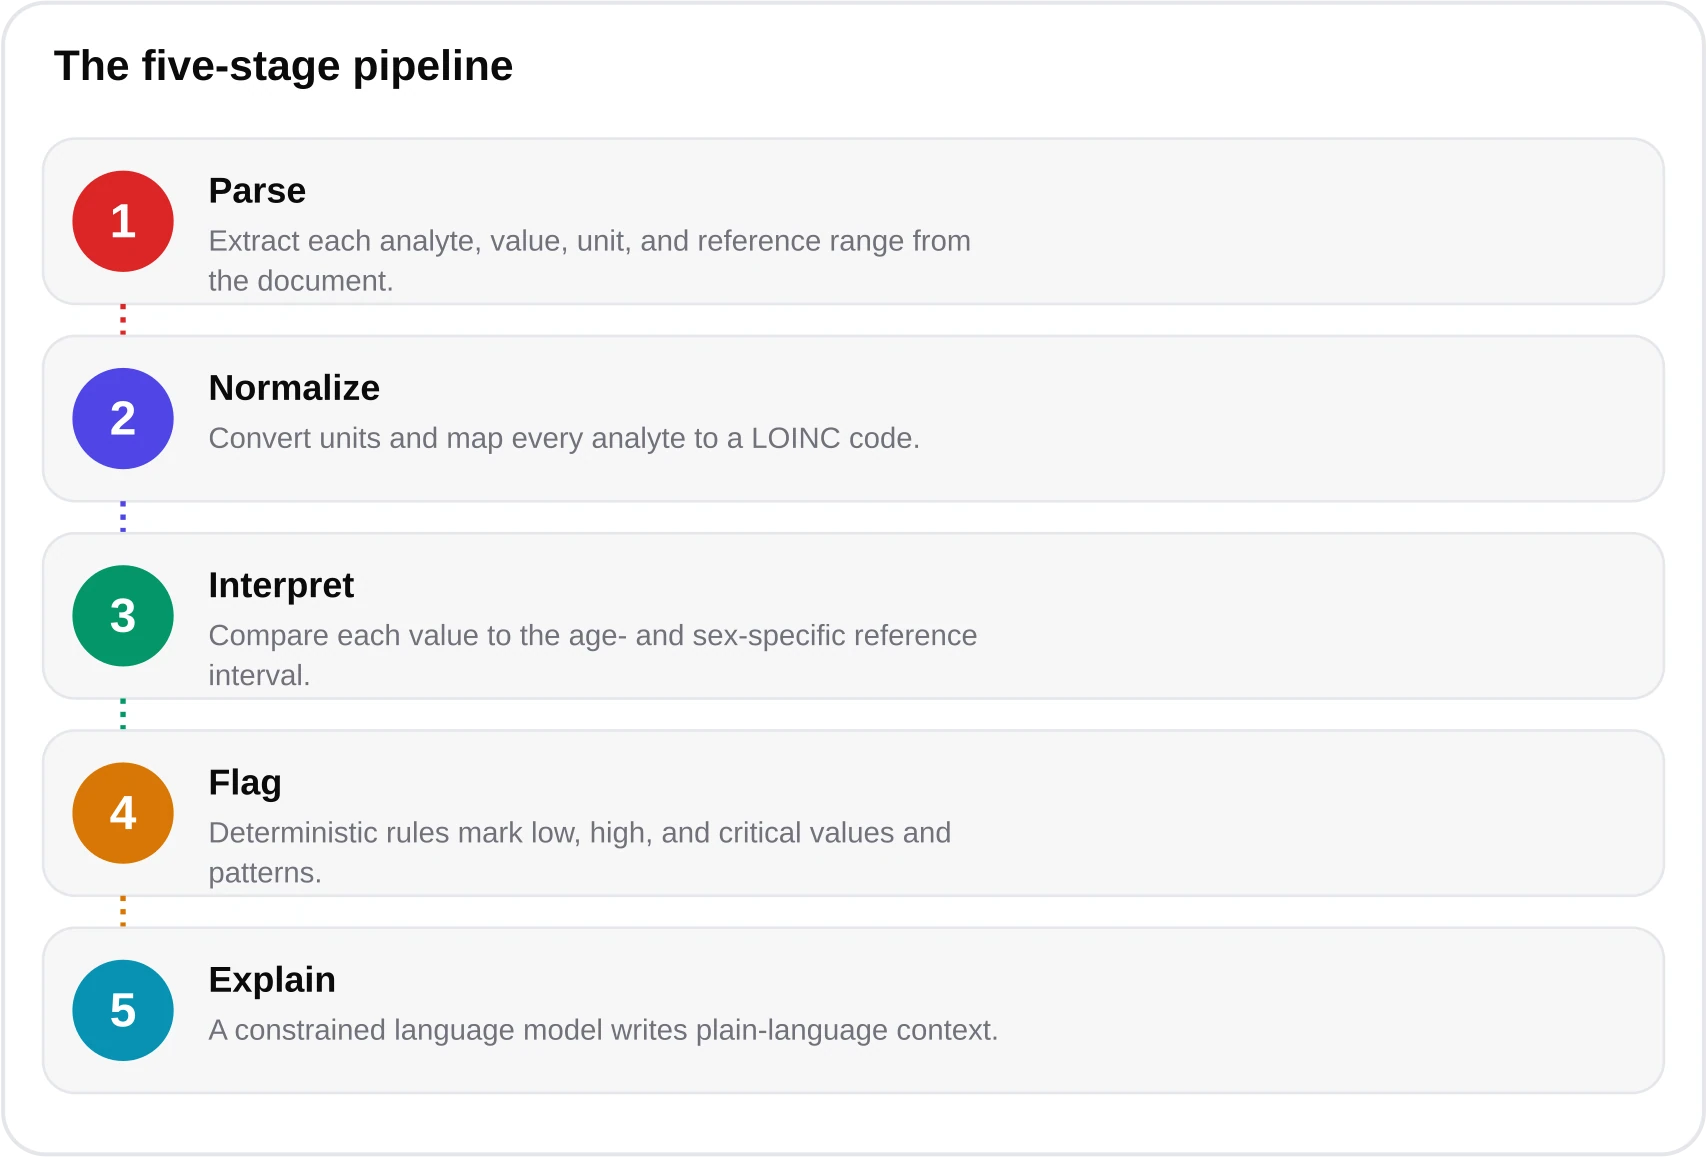
What comes back is a structured report, not a wall of jargon. For each biomarker you see the value placed against the correct reference range, a clear flag (normal, borderline, high, low, or critical), and a plain-language explanation of what that analyte measures and why it might move. Results are grouped by system — metabolic, liver, kidney, lipids, thyroid, blood count — so patterns become visible. A single mildly elevated liver enzyme reads very differently when you can see the whole hepatic panel beside it. Learn more about how the reading is generated on our AI blood test analyzer page and in our overview of how machine learning reads labs.


Is It Safe and Free? Privacy, Cards, Deletion
The most common and most reasonable question about any tool that lets you upload blood test results is whether it is genuinely free and genuinely private. Health data is among the most sensitive information you own, so the standard should be high. A trustworthy free analyzer meets a specific set of conditions, and you should verify each before you upload anything.

On cost: our analyzer is free during the 2026 public beta, with no credit card required to run a report. For readers who want deeper reporting after the beta, credit packs exist — Starter (5 credits, $24.90), Pro (20 credits, $69.90), and Family (50 credits, $149.90), with 60% off right now — but nothing gates a basic reading behind payment. You can review the details on our pricing page.
On privacy: uploaded files are deleted after your report is delivered, and your data is never used to train models. Operations are HIPAA-aligned and compliant with GDPR and CCPA. That last point is the one most people overlook. "Free" is not free if the price is your data feeding a training set. A defensible policy states plainly that documents are processed to produce your result and then removed, and that no model learns from your labs. Our approach is described further on the how it works page and in our FAQ.

A free health tool earns trust the same way a clinician does — by being explicit about what it does with your information and honest about the edges of what it can tell you.
— Dr. James Carter, MD
Accuracy Expectations and Honest Limits
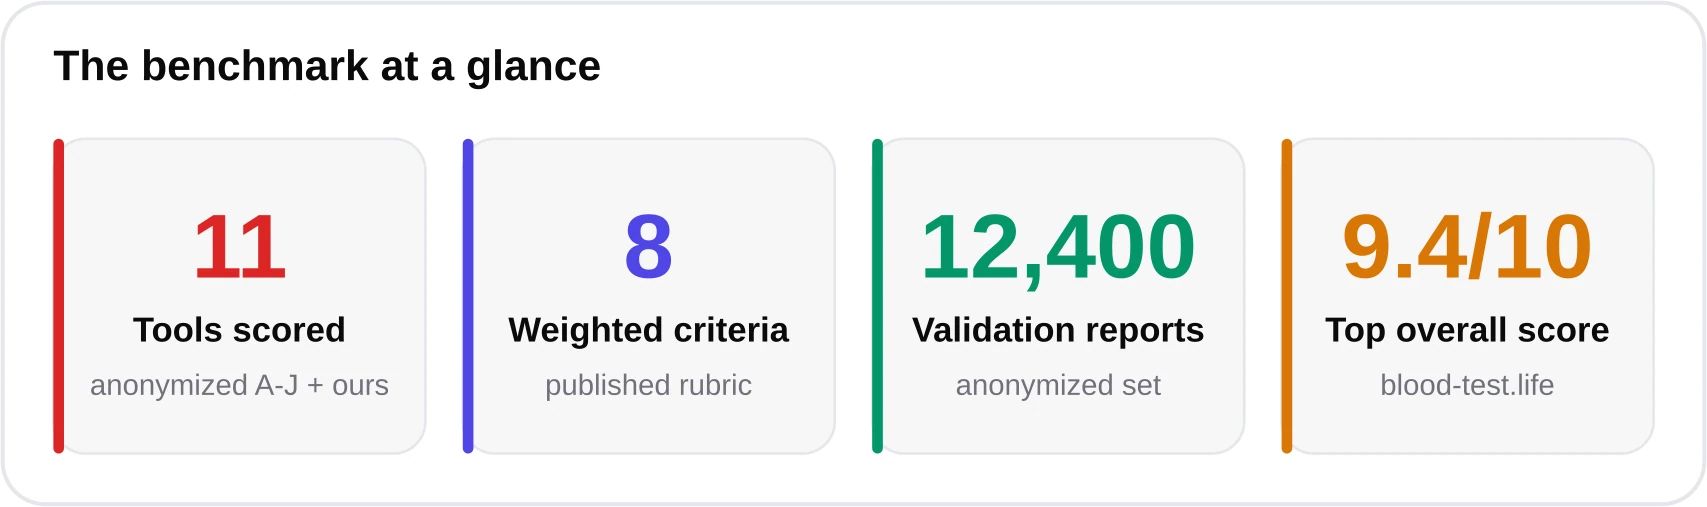
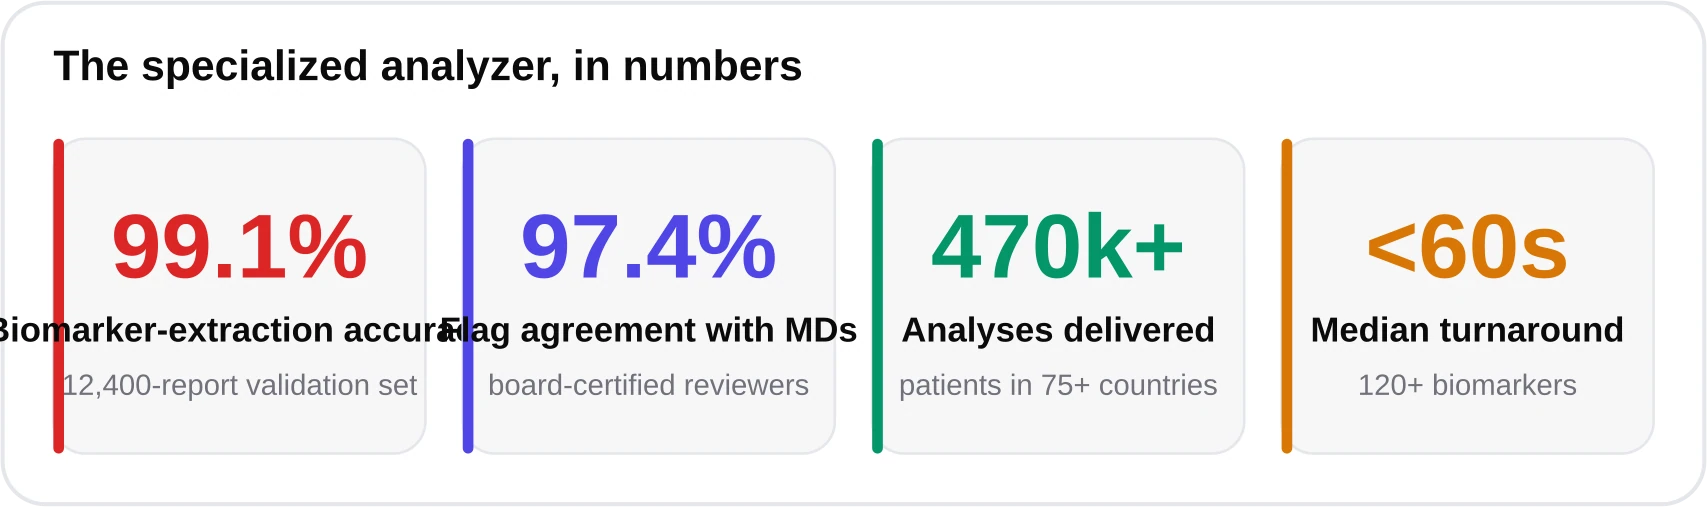
Accuracy has two distinct components, and conflating them causes confusion. The first is extraction accuracy: did the tool read the right number from your document? The second is interpretation agreement: does the flag it applies match what a clinician would say? On a validation set of 12,400 real reports, our system reached 99.1% biomarker-extraction accuracy and 97.4% flag-agreement with physicians. Those are strong numbers, but neither is 100%, which is the whole point of the limits below.


Now the honest limits. First, an online analyzer is not a medical device and does not diagnose. It is an educational aid that helps you understand numbers and prepare better questions for your clinician. Second, roughly 5% of perfectly healthy people fall outside any given reference range — reference intervals are defined as the central 95% of a healthy population, so a lone borderline flag is often noise, not disease. Third, results are a snapshot; trends over time and your symptoms and history carry more meaning than any single value. The USPSTF and specialty bodies like the ADA, AHA/ACC, and ESC set screening and treatment thresholds using clinical context, not isolated lab numbers. For a deeper comparison of AI reading against a general chatbot, see our piece on AI interpretation vs. ChatGPT.
What this tool is not
It is not a diagnosis, not a prescription, and not a substitute for your doctor. Critical or rapidly changing values — very high glucose, very low hemoglobin, markedly abnormal potassium — warrant prompt medical attention regardless of what any tool says.
Step-by-Step: Enter Your Results Free
Here is the full flow from document to report. The whole process takes under a minute once your file is ready.

- Gather your data. Download the PDF from your patient portal, or have your printed report and a well-lit camera ready. For manual entry, list each biomarker, value, and unit.
- Open the free analyzer. Go to the free blood test analyzer. No account or card is required during the beta.
- Choose your method. Upload the file, or switch to manual entry and type your values. You can also enter your blood test results online free directly in the Kantesti engine that powers blood-test.life.
- Add context. Enter your age and biological sex so partitioned reference ranges apply. Note fasting status for glucose and lipids.
- Confirm units. If you typed values, double-check each unit against your report — this is where manual errors hide.
- Run the analysis. The report generates in under 60 seconds, covering 1,000+ possible biomarkers across 10,000+ lab formats.
- Review and save. Read the flags, ranges, and explanations. Keep the summary to bring to your next appointment.


Reading and Acting on Your Report
A report is only useful if you act on it well. Start by separating signal from noise. A single value one point outside a range, with everything else normal and no symptoms, is usually the expected statistical scatter — remember the ~5% rule. Patterns matter more: several liver enzymes up together, or fasting glucose plus HbA1c plus triglycerides all trending high, tell a coherent story that one number cannot.
Understanding common thresholds
Some cutoffs are worth knowing. Per the American Diabetes Association, an HbA1c of 5.7-6.4% indicates prediabetes and 6.5% or higher indicates diabetes. Fasting glucose of 100-125 mg/dL is prediabetic and 126 mg/dL or above (on repeat testing) is diabetic. These are screening thresholds, not self-diagnoses — confirmation and management belong with a clinician. Browse individual markers in our biomarker library to understand what each one measures.

Bringing results to your clinician
The best outcome of entering your results online is a better conversation with a professional. Arrive with specifics: which values were flagged, by how much, and what you want to understand. A structured summary turns a rushed appointment into a focused one. Ask whether a borderline value needs rechecking, whether it fits your history, and what — if anything — should change. For a broader look at the preventive angle, see our article on AI and preventive health and our lab test analyzer overview.
Used this way — as a fast, private, free first read that sharpens your questions rather than replacing your doctor — an online analyzer is one of the most practical tools in consumer health today. It converts a portal full of acronyms into something you can actually understand and act on, in under a minute, at no cost during the beta.
Frequently asked questions
Can I really enter blood test results online free with no credit card?
Yes. The blood-test.life analyzer, powered by Kantesti's AI infrastructure, is free during the 2026 public beta and requires no card to run a report. Optional credit packs exist for deeper reporting after the beta, but a basic interpretation is not gated behind payment.
Is it better to upload a PDF or type my values manually?
Upload a native PDF whenever you have one — it reads your entire panel and preserves the lab's own reference ranges with minimal error. Type values manually only for a few numbers or when your document is too blurry to trust; manual entry carries a 1-2% per-field transcription-error risk.
What happens to my file after I upload it?
Uploaded files are deleted after your report is delivered, and your data is never used to train models. Operations are HIPAA-aligned and comply with GDPR and CCPA. Verify these conditions on any tool before uploading health documents.
How accurate is the AI interpretation?
On a 12,400-report validation set, extraction accuracy was 99.1% and flag-agreement with physicians was 97.4%. Accuracy is high but not perfect, and about 5% of healthy people fall outside any reference range, so treat isolated flags as questions, not conclusions.
Is entering my results online a diagnosis?
No. An online analyzer is an educational aid, not a medical device, and it does not diagnose or prescribe. Use the structured report to understand your numbers and prepare focused questions for your clinician, who interprets results alongside your history and symptoms.
What data do I need to get started?
At minimum, each biomarker's name, value, and unit (for example Glucose, 112, mg/dL). Adding your age and biological sex lets the tool apply age- and sex-specific reference ranges, which makes the interpretation more precise.
References & sources
- World Health Organization — laboratory and diagnostics standards — WHO
- Centers for Disease Control and Prevention — reference population data (2024) — CDC
- American Diabetes Association — Standards of Care, HbA1c and glucose thresholds — ADA
- National Heart, Lung, and Blood Institute — lipid and cardiovascular guidance — NHLBI
- LOINC — universal codes for laboratory observations — Regenstrief / LOINC
- U.S. Preventive Services Task Force — screening recommendations — USPSTF
- IFCC — international standardization of laboratory measurement — IFCC
- CALIPER and NORIP — pediatric and Nordic adult reference intervals — CALIPER / NORIP
Medical disclaimer
This article is informational and educational only and is not a substitute for professional medical advice, diagnosis, or treatment. blood-test.life is not a medical device. Always consult your physician or a qualified health provider about your results. Read our full medical disclaimer.